Death Clock Clone
Longevity prediction and health intelligence — vitality survival model, SSA baselines, and retrieval-grounded explanations.
Overview
This project is a longevity prediction and health intelligence platform built around a vitality-based survival model. It takes a detailed lifestyle and health questionnaire, turns answers into structured risk features, and runs a statistical engine to estimate lifespan, survival-curve behavior, and major contributors to risk. On top of that, it pairs the engine with a document-grounded AI layer that explains results using medical research and longevity literature — so users get both a number and the evidence behind it.
Demo video
Walkthrough of the product experience: onboarding, prediction, and how explanations show up in the UI.
Research stack: AlphaXiv → Drive → NotebookLM → lifelines
Before writing the vitality engine, I used a concrete toolchain to learn survival analysis and longevity modeling: AlphaXiv for discovery and deep reading, Google Drive as the shared paper library, NotebookLM to synthesize PDFs into cited notes and design prompts, and lifelines (in Colab or a local environment) to fit Cox and parametric models and log experiments. This is not an autoresearch loop — you run the searches, attach sources, implement, and sync logs back yourself — which kept the pipeline transparent and evidence-led.
Mind map: how the apps connect
Flow from literature → storage → synthesis → code → metrics, with logs feeding back into NotebookLM for reflection.
1. AlphaXiv — discovery & reading
Use AlphaXiv’s search and Q&A to find survival-analysis and longevity papers, read summaries, ask follow-ups, and download PDFs into a dedicated Drive folder (e.g. Lifespan-Papers-Core). Example queries that surface useful model families and evaluation ideas:
- human mortality Gompertz Makeham
- Cox proportional hazards survival analysis
- longevity biomarker survival model
- frailty model aging mortality
- genetic heritability human lifespan
- competing risks survival analysis elderly
2. NotebookLM — synthesize the Drive folder
Create a notebook and attach the Drive folder as a source. Example prompts (answers are short and citation-aware — good for README and design docs):
- Summarize the mathematical form of the Gompertz–Makeham hazard and typical parameters in human mortality studies.
- Compare assumptions of Cox proportional hazards vs a parametric Weibull model for lifespan prediction.
- From the uploaded papers, list covariates (age, sex, BMI, smoking, biomarkers) that most often improve C-index in human lifespan models.
- Propose an evaluation protocol (train/validation split, concordance, calibration) on a public cohort such as Framingham.
3. lifelines — implement & test
Standard survival columns: T (time to event or censoring), E (event indicator), X (covariates from your questionnaire features).
| Symbol | Meaning |
|---|---|
| T | Observed time (entry → event or censoring) |
| E | Event (1 = death, 0 = censored) |
| X | Covariate matrix from your survey (demographics + lifestyle / health answers) |
pip install lifelines
pip install pandas pyyaml
Example Cox run writing metrics for later NotebookLM review (use a real hold-out split in production):
import pandas as pd
from lifelines import CoxPHFitter
from lifelines.utils import concordance_index
import json, pathlib

df = pd.read_csv("data/framingham.csv")  # columns: T, E, age, sex, bmi, smoke, ...

cph = CoxPHFitter(penalizer=0.1)
cph.fit(df, duration_col="T", event_col="E", show_progress=False)

pred = cph.predict_partial_hazard(df)
ci = concordance_index(df["T"], -pred, df["E"])
print(f"C-index: {ci:.3f}")

pathlib.Path("experiments/logs").mkdir(parents=True, exist_ok=True)
with open("experiments/logs/cox_run.json", "w") as f:
    json.dump({"model": "Cox", "c_index": ci, "params": cph.params_.to_dict()}, f)
Parametric fits (Weibull, Gompertz, etc.) follow the same pattern: fit on T/E, save JSON under experiments/logs/, and export plots (e.g. Kaplan–Meier) alongside.
4. Close the loop in NotebookLM
Sync experiments/logs (or a periodic archive) into the same Drive tree attached to NotebookLM. Then you can ask reflective questions that use both the papers and your runs — for example which covariates show up in top-performing models, how expected remaining life moves with smoking, or whether a frailty term is worth testing next.
Quick checklist
| Step | Action | Output |
|---|---|---|
| 1 | Search AlphaXiv with targeted queries | Curated PDFs |
| 2 | Store PDFs in Drive (Lifespan-Papers-Core) | NotebookLM source set |
| 3 | Run NotebookLM prompts | Formulas, covariates, evaluation protocol |
| 4 | Implement Cox / parametric models in lifelines | Working fits + logs |
| 5 | Save JSON and plots under experiments/logs | Experiment record |
| 6 | Sync logs to Drive → NotebookLM | Reflective Q&A on literature + runs |
Explore the model (Colab)
The full pipeline — questionnaire schema, feature engineering, SSA baselines, vitality parameters, optional NHANES/Cox calibration, and paper ingestion for RAG — lives in an interactive notebook. Embed below may be blocked by Google in some browsers; if the frame is blank, open the notebook directly.
How it works
1. Statistical prediction engine
The quantitative layer starts from an actuarial mortality baseline, then adjusts for user-specific factors — diet, exercise, sleep, stress, biomarkers, family longevity, and healthcare behavior. Answers are normalized into numeric features, mapped to vitality parameters (initial health reserve, decline rate, volatility, shock risk), and turned into a predicted death age, an estimated date, and a survival curve.
2. AI explanation layer
A retrieval-based system searches longevity papers, cohort studies, and meta-analyses, then generates explanations grounded in those passages instead of inventing citations. That keeps the product closer to a health analysis system than a generic chatbot.
Core workflow
- User completes a multi-step questionnaire.
- Answers are normalized to a consistent schema.
- Features are derived for the vitality engine.
- The model estimates lifespan and risk trajectory.
- Retrieval pulls relevant studies.
- The AI layer explains results with that context.
- The app surfaces prediction, uncertainty, and actionable insight.
What is Death Clock?
Death Clock is a longevity engine that estimates life expectancy from lifestyle, biomarkers, and family history. It uses a 29-question survey together with actuarial baselines and evidence-linked hazard adjustments, then adds AI explanations tied to retrieved literature.
| Traditional calculators | Death Clock |
|---|---|
| 5–10 questions | 29 comprehensive questions |
| Opaque coefficients | Hazard ratios from published studies |
| One-size-fits-all | Sex-specific SSA baselines |
| No context | Retrieval-grounded explanations and reports |
Vitality model architecture
Health is modeled as a vitality process; death occurs when vitality reaches zero. A compact representation:
| Parameter | Meaning |
|---|---|
| y₀ | Initial vitality — health reserve today |
| ζ | Drift (rate of decline; non-positive in the implementation) |
| σ | Volatility — uncertainty around the path |
| λ | Jump hazard — risk of sudden shocks |
The model is anchored to published effect sizes — for example, Li et al. (Circulation, 2018) on healthy lifestyle and life expectancy — so the allowed vitality swing stays consistent with cohort evidence.
Vitality process: stochastic path, shocks, and survival linkage.
# Vitality hits zero → death; SSA baseline + lifestyle shift
# y(t) = y₀ + ζ·t + σ·W(t) + jumps  (implemented with baseline q(x) adjustment)

pred = vitality_to_prediction(params, age, sex)
# → predicted_death_age, year_adjustment vs SSA, survival curve, etc.
Literature-based hazard adjustments
Risk factors map to hazard ratios from specific sources; combined effects are damped for correlation (e.g. fractional exponent on the combined HR). Examples:
| Category | Source | Effect (summary) |
|---|---|---|
| Exercise (cardio) | Arem et al. 2015, JAMA Intern Med | Large mortality reduction at highest activity |
| Blood pressure | Lewington et al. 2002, Lancet | Higher risk under hypertension |
| Smoking | Jha et al. 2013, NEJM | Strong hazard increase for daily smokers |
| BMI / obesity | Di Angelantonio et al. 2016, Lancet | Elevated hazard in obese range |
| Social isolation | Holt-Lunstad et al. 2015 | Meaningful mortality association |
Actuarial foundation
Predictions use SSA period life tables (e.g. 2022) as the population baseline by age and sex. Individual forecasts scale relative to that baseline using the lifestyle and biomarker adjustments from the model.
Notebook figures
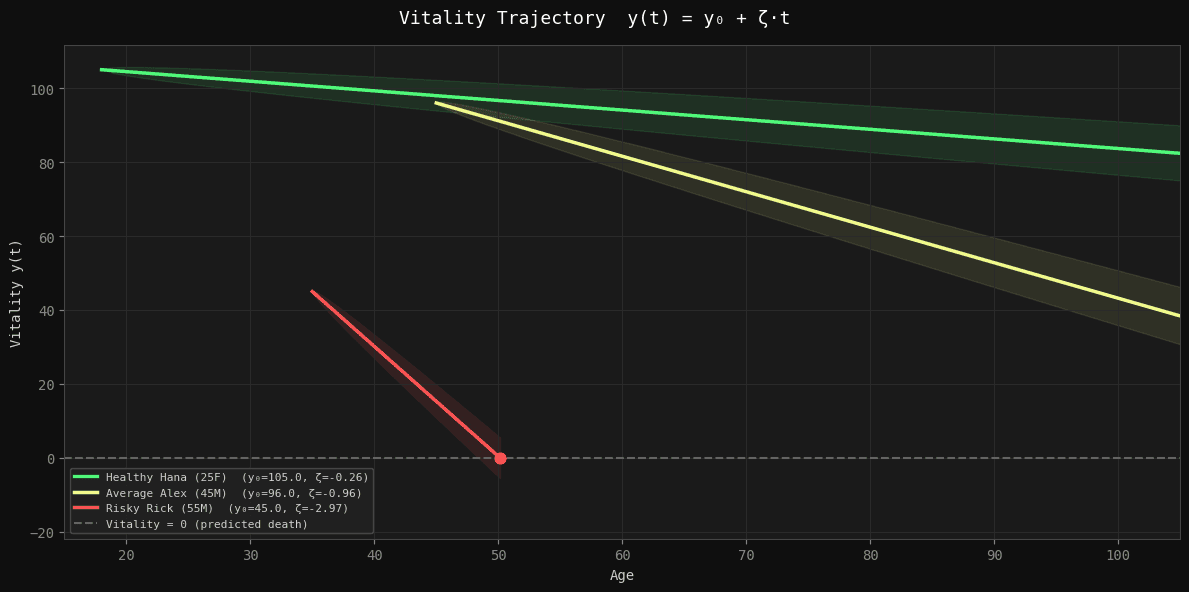
The Colab notebook generates the plots below (SSA q(x) linear vs log, survival curves for example profiles, vitality trajectories y(t)=y₀+ζt with uncertainty bands, and a multi-panel profile dashboard). Run the notebook to reproduce the full-resolution exports.
# SSA 2022 — annual mortality q(x), linear vs log (Gompertz shape)
fig, axes = plt.subplots(1, 2, figsize=(14, 5))
axes[0].plot(ages, SSA_QX_MALE, label="Male")
axes[0].plot(ages, SSA_QX_FEMALE, label="Female")
axes[1].semilogy(ages, SSA_QX_MALE, label="Male")
axes[1].semilogy(ages, SSA_QX_FEMALE, label="Female")
# … baseline survival + lifestyle-adjusted curves, vitality trajectories, dashboard …
- SSA mortality q(x) — linear and log scales; log scale highlights Gompertz-style exponential growth at older ages.
- Survival curves — SSA baseline vs lifestyle-adjusted paths for profiles such as Healthy Hana, Average Alex, and Risky Rick; predicted death ages annotated.
- Vitality trajectories — deterministic drift plus optional uncertainty shading until vitality reaches zero.
- Profile dashboard — baseline vs predicted death age, y₀ and ζ, year adjustments, BMI vs thresholds, and a lifestyle radar chart.
Product surface
- Client app (e.g. Expo) — multi-step onboarding, live prediction UI, risk breakdown, what-if comparisons, PDF-style longevity report, and concierge chat grounded on the user profile.
- Backend API (e.g. FastAPI) — routes for predict, explain, what-if, report, and chat over the same core model and retrieval stack.
- Notebook — data prep, SSA baselines, calibration hooks, paper ingestion, embeddings, and evaluation.
├── bruh/                        # Expo/React Native mobile app
│   ├── store/                   # Zustand state management
│   └── assets/                  # Images, fonts
│
├── backend/                     # FastAPI backend
│   ├── app/
│   │   ├── main.py             # API routes
│   │   ├── schemas.py          # Pydantic models
│   │   └── model/
│   │       ├── questionnaire.py # Survey schema & scoring
│   │       ├── features.py     # Feature engineering
│   │       ├── baseline.py     # SSA life tables
│   │       ├── vitality.py     # Vitality model
│   │       ├── literature.py   # Hazard ratios from literature
│   │       ├── cox.py          # Cox PH calibration
│   │       ├── explain.py      # Risk factors & explanations
│   │       ├── chat.py         # AI concierge prompts
│   │       └── report.py       # Longevity report generation
│   │
│   └── requirements.txt
│
└── death-clock-v2.ipynb         # Full development notebook
Example repository layout for app, API, and notebook assets.
Goal
Turn a long health questionnaire into a personalized longevity forecast that is both mathematically grounded and easy to understand — part actuarial engine, part research assistant, part coach — with a predicted range, a death-date estimate, and a clear story of which factors moved the needle.
References
- SSA — Period Life Tables (U.S. Social Security Administration)
- Li et al. 2018, Circulation — Association of healthy lifestyle with life expectancy
- Arem et al. 2015, JAMA Intern Med — Leisure-time physical activity and mortality
- Lewington et al. 2002, Lancet — Age-specific relevance of usual blood pressure to mortality
- Ezzati et al. 2002, Lancet — Selected major risk factors and global burden of disease
- Jha et al. 2013, NEJM — 21st-century hazards of smoking
- Di Angelantonio et al. 2016, Lancet — Body-mass index and all-cause mortality
- Holt-Lunstad et al. 2015 — Loneliness and social isolation as risk factors for mortality
- PubMed — literature search for retrieval and evidence grounding
Tech stack
Main technologies used across the mobile client, API, notebooks, and retrieval layer.
- Expo Go
- TypeScript
- Python
- Google Colab
- RAG
- ChromaDB
- Groq
- Meta Llama
- Zustand
- React
- Expo Router
- Pydantic
- NumPy
- FastAPI